
Note
Go to the end to download the full example code.
Surfaces in the viewer#
A surface, such as the white matter surface FreeSurfer makes, is drawn in the 3D view as a shaded mesh and in the 2D views as the line where each slice cuts it. Its values per vertex, such as its curvature, can colour it.
This example builds a synthetic head and a folded surface inside it, with a curvature-like value per vertex, and saves screenshots of the 3D view coloured by that value and of the axial view with the cut line over the head.
A synthetic head#
A 2 mm image of an ellipsoid centred at the world origin (world coordinates are in mm, RAS+), as in the other examples.
shape = (90, 108, 90)
affine = np.diag([2.0, 2.0, 2.0, 1.0])
affine[:3, 3] = -np.array(shape)  # half the extent in mm: the centre at 0
i, j, k = np.indices(shape, dtype=np.float32)
x, y, z = (2 * i / shape[0] - 1, 2 * j / shape[1] - 1, 2 * k / shape[2] - 1)
r = np.sqrt((x / 0.8) ** 2 + (y / 0.9) ** 2 + (z / 0.85) ** 2)
head = Volume(np.where(r < 0.9, 600 - 300 * r, 0).astype(np.float32), affine)
A folded surface#
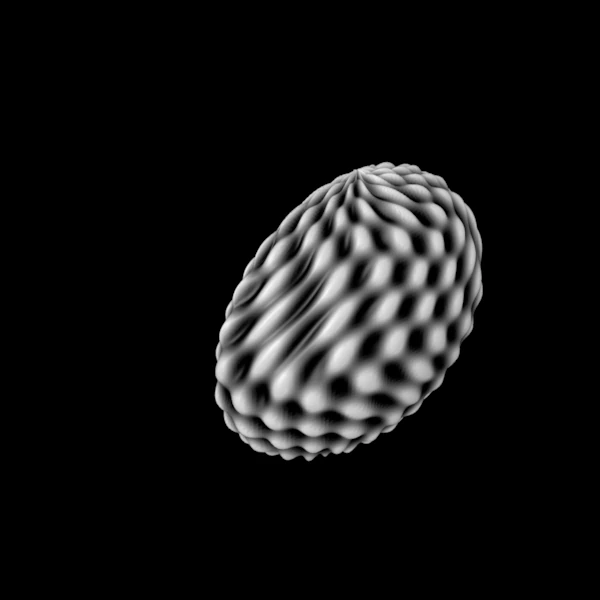
One hemisphere-like shape: an ellipsoid, long front to back and flattened on its inner (right) side, meshed by latitude and longitude, its radius rippled into folds. A surface holds its vertices in world coordinates (mm) and its faces as vertex indices, counter-clockwise seen from outside. The ripple, negated, plays the part of FreeSurfer’s curvature: positive in the folds’ troughs (sulci), negative on their crests (gyri). It is stored as the values “curv”, the name FreeSurfer’s curvature files get.
rows, columns = 120, 240
theta = np.linspace(0, np.pi, rows)[:, None]  # from the top down
phi = np.linspace(0, 2 * np.pi, columns, endpoint=False)[None, :]  # around
ripple = np.sin(17 * phi + 3 * np.cos(4 * theta)) * np.sin(
    13 * theta + 2 * np.sin(3 * phi)
)
radius = 1 + 0.04 * ripple
sx = np.sin(theta) * np.cos(phi)
sy = np.sin(theta) * np.sin(phi)
sz = np.cos(theta) * np.ones_like(phi)
sx = np.where(sx > 0, 0.35 * sx, sx)  # the flat inner side faces the midline
points = np.stack(
    [-30 + 35 * radius * sx, 70 * radius * sy, 5 + 55 * radius * sz], axis=-1
).reshape(-1, 3)
faces = []
for row in range(rows - 1):
    for column in range(columns):
        a = row * columns + column
        b = row * columns + (column + 1) % columns
        faces += [[a, a + columns, b], [b, a + columns, b + columns]]
surface = Surface(points, np.array(faces), vertex_data={"curv": -ripple.ravel() / 2})
The viewer and its items#
Surfaces are added like the other items; load reads a FreeSurfer surface (such
as lh.white, with its lh.curv beside it) or a GIfTI surf.gii file. A name
with “white” in it gives the surface yellow, as FreeSurfer’s viewer does, and a
surface with “curv” values starts coloured by them.
viewer = Viewer()
# The screenshots hide the crosshair and the text, so they show only the data.
viewer.toggle_crosshair()
viewer.toggle_overlay()
head_item = viewer.add(head, Category.VOLUMES, name="head")
item = viewer.add(surface, Category.SURFACES, name="lh.white")
Coloured by curvature#
In grey from -0.3 to 0.3, the troughs dark and the crests light. The head would hide the surface in the 3D view, so it is hidden for this screenshot.
viewer.set(head_item.id, OptionName.VISIBLE, False)
viewer.screenshot(ViewKind.THREE_D, "viewer_surfaces_curvature.png", size=(600, 600))
The cut line#
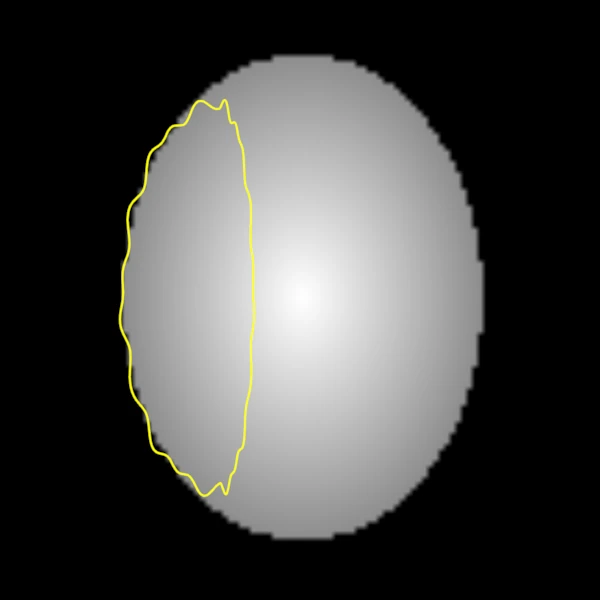
On the 2D views, the line where the slice cuts the surface, here in the surface’s own colour after switching the values off. Cut lines are how a surface is checked against its T1; the Cut lines option turns them off.
viewer.set(head_item.id, OptionName.VISIBLE, True)
viewer.set(item.id, OptionName.COLOUR_BY, None)
viewer.screenshot(ViewKind.AXIAL, "viewer_surfaces_cut_line.png", size=(600, 600))
print(f"{surface.num_vertices} vertices, {surface.num_faces} faces")
28800 vertices, 57120 faces