Note
Go to the end to download the full example code.
Finding the peaks of FODs#
The peaks of an FOD are its local maxima: the directions of the fibres in a voxel,
each with an amplitude. find_peaks finds them from the FOD’s SH coefficients,
largest first, and drops those far smaller than the largest.
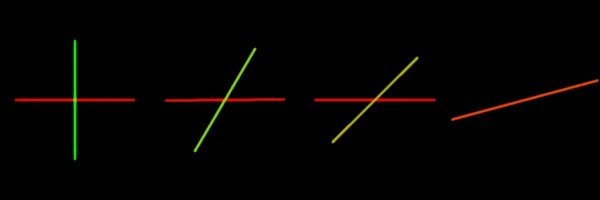
This example builds FODs of two fibres crossing at 90, 60, 45 and 30 degrees, finds
their peaks, prints the angle between the two largest in each voxel, and draws the
peaks as lines, as lar peaks would write them to a file.
The search follows sh2peaks of MRtrix3: Tournier JD et al. MRtrix3: A fast,
flexible and open software framework for medical image processing and
visualisation. NeuroImage 202 (2019) 116137.
import numpy as np

from larmor.sd import find_peaks, fit_sh
from larmor.types import Volume
from larmor.viewer import Category, Viewer, ViewKind
FODs of crossing fibres#
Each FOD is made from its amplitudes on 600 directions over the sphere, a narrow lobe along each fibre, fitted with SH up to degree 8. The fibres lie in the axial plane: one along x, the other turned from it by the crossing angle.
n = 600
z = 1 - (2 * np.arange(n) + 1) / n
azimuth = np.pi * (3 - np.sqrt(5)) * np.arange(n)
radius = np.sqrt(1 - z**2)
dirs = np.stack([radius * np.cos(azimuth), radius * np.sin(azimuth), z], axis=1)

angles = [90, 60, 45, 30]
fods = np.zeros((len(angles), 1, 1, 45), np.float32)
for i, angle in enumerate(angles):
    turned = np.array([np.cos(np.radians(angle)), np.sin(np.radians(angle)), 0.0])
    cosines = dirs @ np.array([[1.0, 0.0, 0.0], turned]).T
    amplitudes = np.exp(-8 * (1 - cosines**2)).sum(axis=1)
    fods[i, 0, 0] = fit_sh(amplitudes, dirs, 8)
The peaks#
Up to 3 peaks per voxel. A symmetric FOD has a lobe at both ends of a fibre, so each fibre is one peak, pointing up (z >= 0). Where the fibres cross at a small angle, their lobes merge into one.
peaks = find_peaks(fods, num_peaks=3)
for i, angle in enumerate(angles):
    found = peaks.directions[i, 0, 0][np.isfinite(peaks.amplitudes[i, 0, 0])]
    if len(found) >= 2:
        between = np.degrees(np.arccos(abs(found[0] @ found[1])))
        print(f"{angle} degrees: {len(found)} peaks, {between:.0f} degrees apart")
    else:
        print(f"{angle} degrees: {len(found)} peak, the fibres are not resolved")
90 degrees: 2 peaks, 90 degrees apart
60 degrees: 2 peaks, 59 degrees apart
45 degrees: 2 peaks, 45 degrees apart
30 degrees: 1 peak, the fibres are not resolved
The peaks as lines#
A peaks image holds, for each peak, its direction scaled by its amplitude: 3 values per peak, NaN where a voxel has fewer peaks. The viewer draws each as a line through the voxel. The screenshot hides the crosshair and the text, so it shows only the data.
vectors = peaks.directions * peaks.amplitudes[..., None]
image = Volume(vectors.reshape(len(angles), 1, 1, 9), np.diag([2.0, 2.0, 2.0, 1.0]))
viewer = Viewer()
viewer.add(image, Category.PEAKS, name="peaks")
viewer.toggle_crosshair()
viewer.screenshot(ViewKind.AXIAL, "peaks_synthetic.png", size=(600, 200), overlay=False)