
Ctrl+K

Larmor

  • Install
  • Gallery
  • User guide
  • Viewer
  • Background
  • Reference
  • Agents
  • About
  • Install
  • Gallery
  • User guide
  • Viewer
  • Background
  • Reference
  • Agents
  • About

Section Navigation

  • Preprocessing
    • Denoising a DWI with MP-PCA
    • Denoising, then removing Gibbs ringing
  • Models
    • Fitting DKI to a real brain
    • Fitting DKI to a synthetic signal
    • DTI of a simulated brain
    • Fitting DTI to a synthetic tensor
  • Spherical deconvolution and peaks
    • Fitting FODs to a synthetic signal
    • FODs, peaks and asymmetric FODs of a simulated brain
    • Finding the peaks of FODs
  • Tractography
    • Structural connectomes
    • Bringing an atlas region into diffusion space
    • Track density images
    • Whole-brain tractography of a simulated brain
    • Tracking streamlines through crossing bundles
    • Tract profiles: FA along a bundle
    • Writing a tractogram batch by batch
  • Files
    • Reading and writing files
    • Reading MRIToolkit results from MATLAB files
  • Viewer
    • Moving around the 2D views
    • The 3D view
    • 4D images in the viewer
    • DTI colours in the viewer
    • FOD glyphs in the viewer
    • A parcellation in the viewer
    • Peaks in the viewer
    • A brain in the viewer
    • Separate views and rotation videos
    • Saving and reopening a viewer session
    • Surfaces in the viewer
    • Tractograms in the viewer
    • Streamlines as tubes
    • Volumes and overlays in the viewer
  • Gallery
  • Spherical deconvolution and peaks

Spherical deconvolution and peaks#

Estimating fibre orientation distributions (FODs) by spherical deconvolution, and finding their peaks.
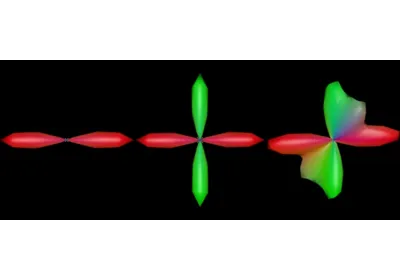
Fitting FODs to a synthetic signal

Fitting FODs to a synthetic signal

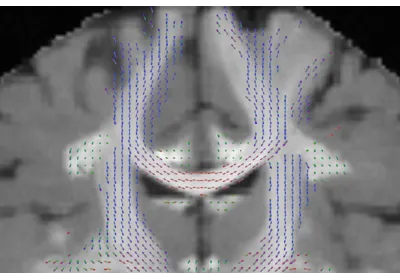
FODs, peaks and asymmetric FODs of a simulated brain
FODs, peaks and asymmetric FODs of a simulated brain

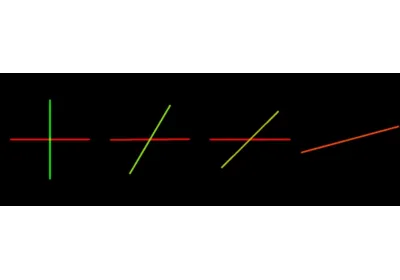
Finding the peaks of FODs

Finding the peaks of FODs