Note
Go to the end to download the full example code.
A parcellation in the viewer#
A parcellation (an atlas, or the output of FreeSurfer) is an image of whole numbers, one per region, with 0 outside every region. Shown as labels, each region gets its own colour, from a lookup table or from built-in colours, and 0 is transparent, so the anatomy shows around the regions.
This example builds a synthetic head and a parcellation of it into eight regions, shows the regions first with the built-in colours and then with a lookup table, then a few of them as surfaces in the 3D view, and saves a screenshot of each.
A synthetic head and its regions#
A 2 mm image of an ellipsoid with a bright scalp and a brain inside it, centred on the world origin (mm, RAS+). Its brain is cut into eight regions, one per octant around the centre: left or right, front or back, top or bottom.
shape = (90, 108, 90)
affine = np.diag([2.0, 2.0, 2.0, 1.0])
affine[:3, 3] = -np.array(shape)
i, j, k = np.indices(shape, dtype=np.float32)
x, y, z = (2 * i / shape[0] - 1, 2 * j / shape[1] - 1, 2 * k / shape[2] - 1)
r = np.sqrt((x / 0.8) ** 2 + (y / 0.9) ** 2 + (z / 0.85) ** 2)
t1 = np.select(
    [r < 0.82, r < 0.9, r < 1.0],
    [500 + 250 * np.cos(9 * r), np.full(shape, 80.0), np.full(shape, 900.0)],
    0.0,
).astype(np.float32)

octant = 1 + (x > 0) + 2 * (y > 0) + 4 * (z > 0)  # 1 to 8
# Only a shell of the brain is labelled, so the anatomy shows in the middle.
regions = np.where((r > 0.45) & (r < 0.82), octant, 0).astype(np.int16)

viewer = Viewer()
# The screenshots hide the crosshair and the text, so they show only the data.
viewer.toggle_crosshair()
viewer.toggle_overlay()
head = viewer.add(Volume(t1, affine), Category.VOLUMES, name="head")
parcellation = viewer.add(Volume(regions, affine), Category.OVERLAYS, name="octants")
viewer.move_cursor((30.0, 30.0, 20.0))  # right, front, top: region 8
Labels with the built-in colours#
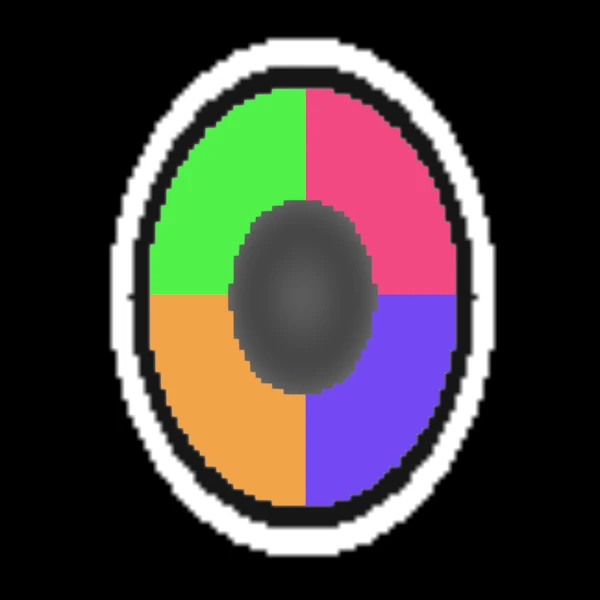
The labels option draws the image as regions instead of through a colormap.
Without a lookup table, the colours are spread around the colour wheel, so that
neighbouring numbers look different.
viewer.set(parcellation.id, OptionName.LABELS, True)
viewer.screenshot(ViewKind.AXIAL, "viewer_labels_builtin.png", size=(600, 600))
Labels from a lookup table#
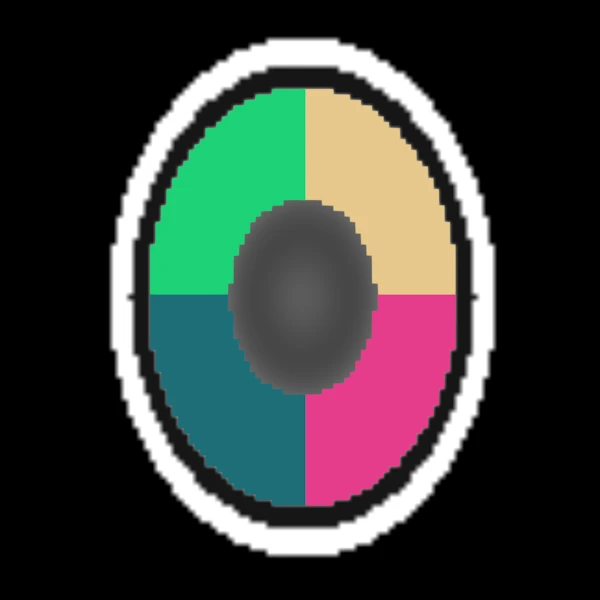
A lookup table names each region and gives its colour, in FreeSurfer’s layout
(index name R G B A, colours from 0 to 255) or MRtrix’s. A region missing from
the table keeps its built-in colour. Here the left regions get cool colours and the
right ones warm colours.
table = Path(tempfile.mkdtemp()) / "octants_lut.txt"  # a file, as from an atlas
lines = ["# index name R G B A"]
for label in range(1, 9):
    right, front, top = (label - 1) & 1, (label - 1) >> 1 & 1, (label - 1) >> 2
    if right:
        rgb = (230, 60 + 140 * front, 40 + 100 * top)
    else:
        rgb = (30, 110 + 100 * front, 200 - 80 * top)
    lines.append(f"{label} octant-{label} {rgb[0]} {rgb[1]} {rgb[2]} 0")
table.write_text("\n".join(lines) + "\n")

viewer.set(parcellation.id, OptionName.LOOKUP_TABLE, str(table))
viewer.screenshot(ViewKind.AXIAL, "viewer_labels_table.png", size=(600, 600))
Regions as surfaces in 3D#
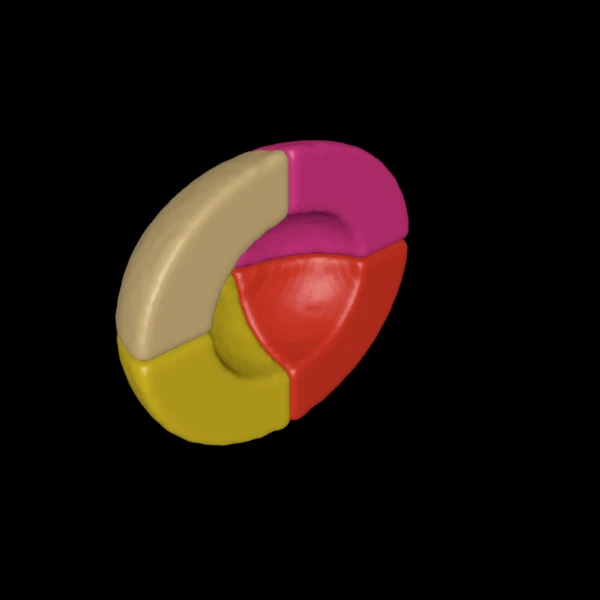
The 3D view draws a surface around each chosen label, in the label’s colour. No
label is chosen at first, as a FreeSurfer parcellation has about a hundred and
each surface takes a moment to compute; the window’s Choose labels button chooses
them from a list, and Python sets surface_labels (labels missing from the image
are refused). Viewer.labels lists the labels the image holds.
print(f"labels in the image: {viewer.labels(parcellation.id)}")
viewer.set(parcellation.id, OptionName.SURFACE_LABELS, [2, 4, 6, 8])  # the right
# The surfaces alone: no slices, and no volume rendering of the head around them.
viewer.set(parcellation.id, OptionName.SLICES_3D, False)
viewer.set(head.id, OptionName.SLICES_3D, False)
viewer.set(head.id, OptionName.OPACITY_3D, 0.0)
viewer.screenshot(ViewKind.THREE_D, "viewer_labels_3d.png", size=(600, 600))
labels in the image: (1, 2, 3, 4, 5, 6, 7, 8)
The readout reports the main volume, the head; the region under the cursor is the parcellation’s value at the readout’s voxel.
readout = viewer.readout()
assert readout.voxel is not None
print(f"region under the cursor: {regions[readout.voxel]}")
assert regions[readout.voxel] == 8
region under the cursor: 8