Tractograms#
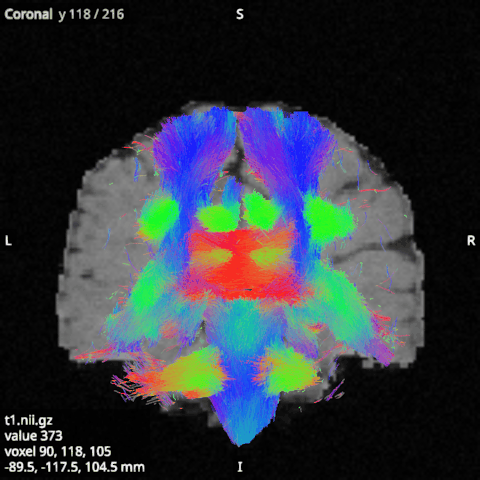
A tractogram is drawn as lines in the 2D views, and as lines or tubes in the 3D view.
Their options#
Colouring: by direction (red left to right, green front to back, blue up and down), in a single_colour (the Colour option), per_tractogram, a different colour for each, or by_value (below).
Subset (%): the share of the streamlines drawn, taken at random, the same ones each time. A subset is often enough to see a tractogram’s shape, and much faster to draw. However large the subset, at most “Streamlines drawn” (a setting, 100,000 by default) are drawn.
Points per streamline: how many points each drawn streamline keeps, 20 by default. More points follow the curves more closely and take longer to draw.
Filter by regions and Ends only, under Regions: draw only the streamlines that pass through chosen regions (below).
Slab and Slab thickness (mm): in the 2D views, only the parts of streamlines within the slab around the slice are drawn, 5 mm thick by default, so a slice shows what passes through it. Turn Slab off to draw every streamline over the slice.
Style and Tube radius (mm), under 3D: lines or tubes in the 3D view (see below).
Opacity (2D) and Opacity (3D).
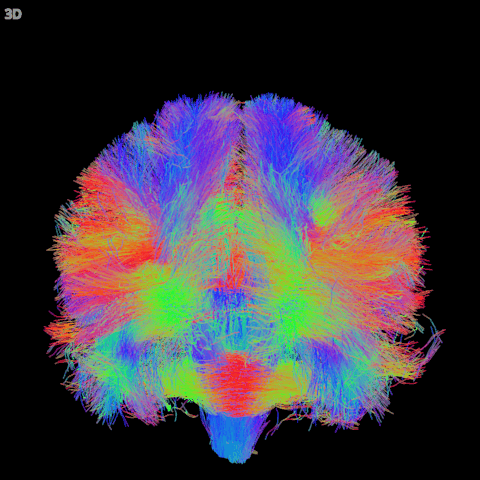
While the 3D view is turned or zoomed, it draws only part of the streamlines, and all of them again when it stops.
Colouring by value#
Each point of a streamline can be coloured by a value, such as the FA where it passes, through a colormap. The values come from one of two places, chosen on the tractogram’s own page under Colour:
TSF file: a track scalar file with one value per point of this tractogram, as MRtrix’s
tcksamplewrites it. The file must match the tractogram’s file streamline by streamline, or it is refused with a message; a tractogram read as a random subset of a larger file takes the values of its streamlines.lar tract-profile --tsf-prefixwrites such files for a bundle: its profile segments, and each map’s profile value.Sampled volume: an image already loaded as a volume or an overlay, with a single volume (FA, MD, a b0), sampled at the drawn points with trilinear interpolation. Points outside the image get 0. The image may be on any grid: the positions are matched in world coordinates.
Choosing either one clears the other, switches Colouring to by_value, and sets Minimum and Maximum to the range of the values (for a sampled volume, the range of the image). Colormap, Minimum and Maximum then work as for an image; values outside the range take the colour of its nearest end. Colour bar, under 2D, shows the colormap and its range at the right edge of the 2D views.
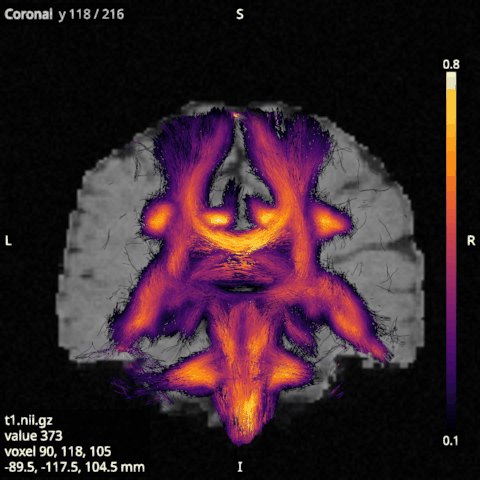
Only the drawn streamlines and points are sampled, once, when the subset, the points per streamline or the values change; a new colormap or range only recolours them. In a session, the TSF file is saved by its absolute path and the sampled volume by its item, with the colormap and the range.
Filtering by regions#
The Regions section of a tractogram’s own page lists the regions its streamlines are filtered by, and adds more:
Add mask: an image already loaded as a volume or an overlay, with a single volume, on any grid. A point is in the mask when the voxel nearest to it holds a value that rounds to a whole number other than 0, so a binary mask, or a probability map above one half, works as it is.
Add sphere at cursor: a sphere centred on the crosshair, with the radius in the field next to the button. Move the crosshair first to where the sphere should go.
Add as: Include keeps only the streamlines that pass through the region; Exclude drops them; Within keeps only the streamlines whose points all lie inside it (the library’s
stays_within).
A streamline passes through a region when at least one of its stored points lies inside it; the line between two points is not tested. With several regions, a streamline is drawn when it passes through every include region and through none of the exclude regions. Ends only tests only each streamline’s first and last point, to keep the streamlines that start or end in the regions. Remove takes out the regions chosen in the list and Clear all of them. Turning Filter by regions off draws every streamline again and keeps the regions, so turning it back on filters again.
The filter runs over all the streamlines loaded, in the background, each time the regions change; the status bar
then says how many of them pass. The subset and the points per streamline apply afterwards, to the streamlines
kept: a subset of 50% draws half of those. Each region is tested with the library’s passes_through. A session
saves the regions: masks by their item, spheres by centre and radius in mm. A mask is an include, an exclude or a
within region, not two of them.
From Python, viewer.add_mask(tracts.id, mask.id), viewer.add_sphere(tracts.id, 5.0) (at the cursor, or
centre=(x, y, z)), each with role=RegionRole.EXCLUDE for an exclude region or RegionRole.WITHIN for a within region, and
viewer.clear_regions(tracts.id); viewer.kept_streamlines(tracts.id) counts the streamlines kept.
Tubes#
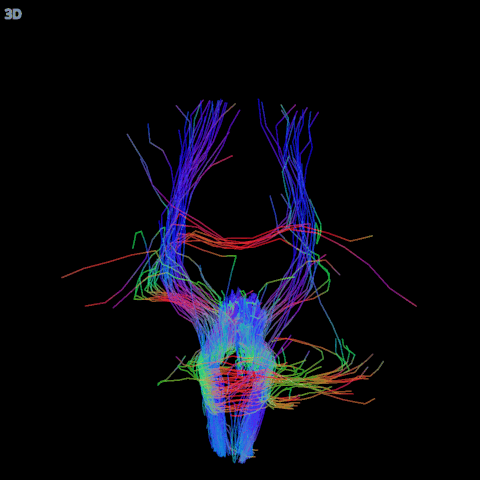
With Style (under 3D) set to tubes, the 3D view draws each streamline as a lit tube, 0.25 mm in radius by default (Tube radius (mm), 0.05 to 2), which shows which streamline passes in front of which. Tubes keep the streamlines’ colouring and opacity; the 2D views keep drawing lines. A tube takes many more triangles than a line, so tubes are drawn only within a budget of segments, “Streamlines drawn as tubes (at 20 points)” (a setting, 40,000 by default): more points per streamline allow fewer streamlines, so 4,000 at 200 points. Past it, the 3D view draws lines and the status bar says so. Lower the subset or the points per streamline, or raise the setting. After a change, the lines show until the tubes are ready, which takes a moment for many streamlines.
The defaults for new tractograms, the read limit and the drawing cap are in Settings.